By: Nolan Eichorn
Anion Concentration Analysis, Lehigh Gap Nature Center
Certain anions, such as chloride, nitrates, and sulfates, which all naturally appear in water, can be very damaging to environments if concentrations are too high or too low. High levels of chloride can be toxic to fish, aquatic organisms, and amphibians, as well as plants, trees, and shrubbery that use contaminated water. Low levels can also negatively affect aquatic life structure, diversity, and productivity. High levels of sulfate can be corrosive, contribute to the acidification of surface water and soil, and contribute to acid rain and fog that damage ecosystems, forests, and plants. High levels of nitrate can be very toxic and can accelerate eutrophication, causing increases in aquatic plant growth and changes in the types of plants and animals that are capable of living in the contaminated water source.
Average chloride concentrations in groundwater should be less than 100 ppm4 (parts per million, mg/L). Average nitrate concentrations should remain under 10 ppm1, and normal sulfate concentrations should be under 20 ppm10.
Method
To determine anion concentrations from the Lehigh Gap Nature Center’s water, ion chromatography was used. This instrumental method involves loading samples from the LGNC, alongside standards, in an autosampler, which introduces the samples to the ion chromatograph, and through an ion exchange resin in the stationary phase, which can measure the concentrations of the anions due to their affinity in that phase. Table 1 shows the relative concentrations for each standard loaded in the IC (ion chromatograph):
Ion Chromatography
Ion chromatography, or IC, is an instrumental method in which samples are injected into a mobile phase (buffer solution) and then pushed through a stationary phase (ion exchange resin), where desired anions are separated based on their interaction with the resin. Ions are detected with a conductivity detector, resulting in a peak for each ion. The peaks are integrated and samples are analyzed and compared to the standard solution calibration curves (peak area as a function of concentration) to determine concentration.

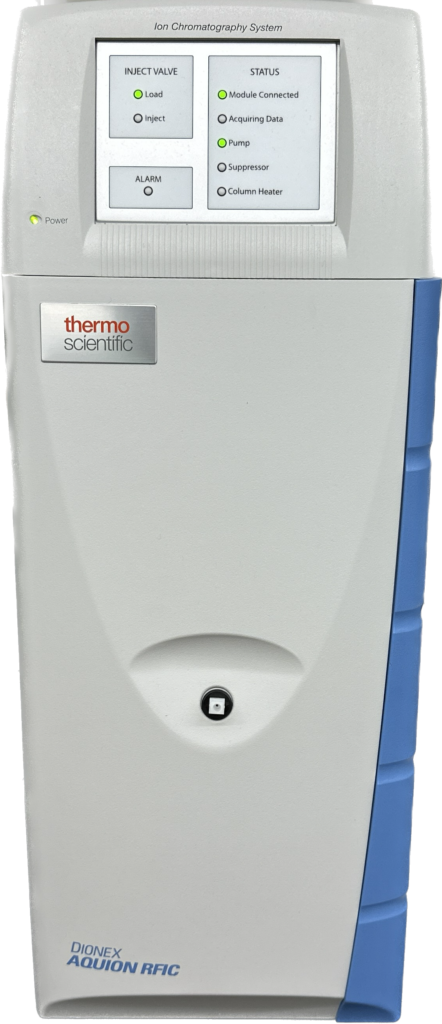
Figure 1: Thermo Scientific Dionex AS-DV Autosampler (pictured left) and a Thermo Scientific Dionex Aquion RFIC Ion Chromatograph (pictured right)
All standards and samples were analyzed with the following instrument parameters: the ion suppressor was set to a current of 31 mA, the flow rate was 1.20 mL/min, and the injection volume was 25 μL.
After the samples were run, a processing method was created, Cobra Wizard was run in the Chromeleon 7 software, and the integration area was set from 3.2 to 13 minutes to consider the void peaks of the 3 anions desired. The baseline noise range was set to Auto Range, and the minimum area was set to 0.1 so that only the three peaks would be detected. The calibration curves were created after entering the appropriate concentrations for each anion for the standards that were made.
Standards
The standards were made in 50-mL volumetric flasks, and to make these standards, all glass and plasticware had to be acid-washed to avoid interference with other analytes. To do this, a 1M rinse with hydrochloric acid was used, followed by a deionized water rinse, then a 1M nitric acid wash, followed by a deionized water rinse, then, lastly, a thorough rinse with Millipore purified water.
To create the four standards, after the plasticware and glassware were clean, 0.0824 g of sodium chloride was weighed and put in one 50-mL volumetric flask, then diluted to the mark. 0.0686g of sodium nitrate was weighed, put in one 50-mL volumetric flask, then diluted to the mark. Lastly, 0.0739g of sodium sulfate was put in one 50-mL volumetric flask, then diluted to the mark.

Table 1: Table of stock and standard solutions made in a 50-mL volumetric flask, filled with Millipore purified water.
Calibration
After IC analysis of the samples and standards, chromatograms were output with 3 peak areas for every sample, one peak for each analyte (example shown in Figure 2). After integrating the areas under the peaks, a calibration curve was created for each analyte (Figure 3) and used to compare the samples’ peak areas to the calibration curve to calculate the concentration of each analyte in each sample.
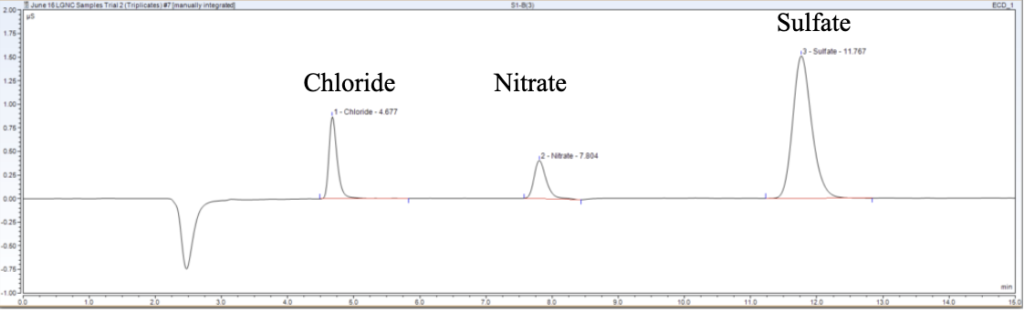
Figure 2: Chromatogram for sample site: Stream 1-B, Osprey House Spring Pipe.
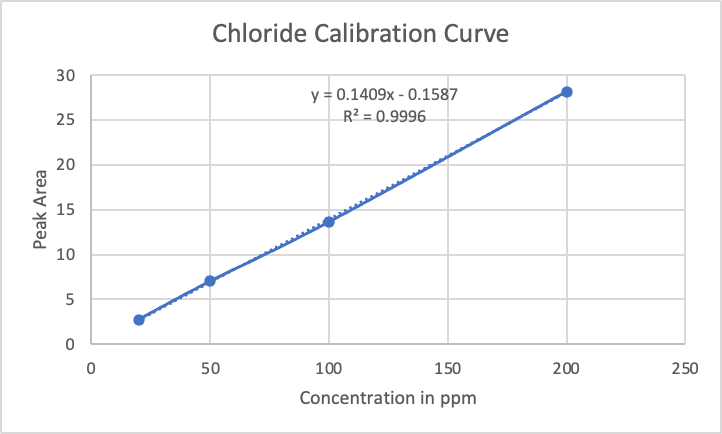
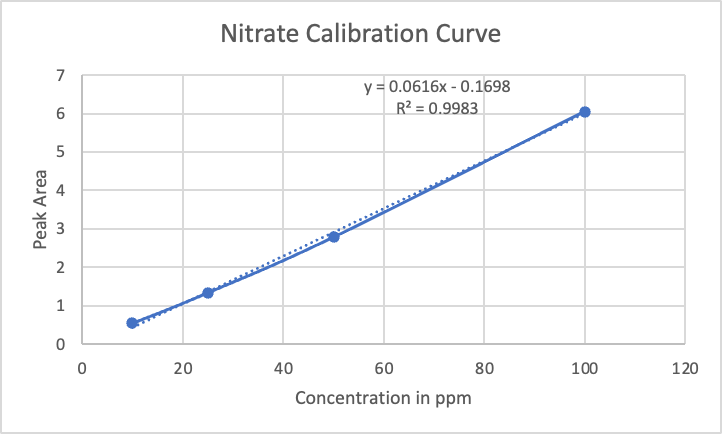
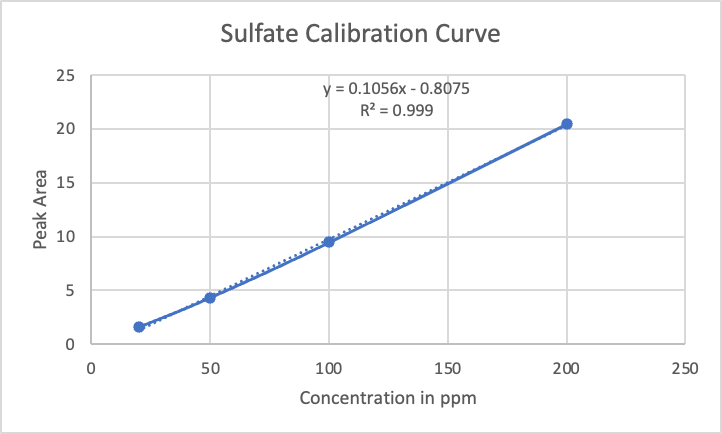
Figure 3: Example calibration curves for chloride, nitrate, and sulfate.
Results
After running triplicates of water from each sample site, the calibration curves were used to calculate relevant anion concentrations. Mean concentrations (± standard deviation) are reported for each site (Tables 2, 3 and 4) and compared to single sample results from spring of 2022 and spring of 2023 (Figures 4, 5 and 6).
Based on the graphs shown below, it is evident that there is an increase in nitrate and sulfate concentrations compared to spring 2022 and spring 2023 (for all sites except for P1, East Pond), but a decrease in chloride concentrations at all sites sampled. The increase in nitrate and sulfate could be attributed to the fact that the sampling was performed when it was dry in the summer months, so the anions would be found in higher concentrations with less water. The decrease in chloride is more unexpected, as there would have been an expected collective increase or decrease in all the analytes together. The reason for this decrease can’t be pinpointed yet, and further sampling and research must be done. However, all the anions are within their respective normal concentration ranges. This shows that the vital efforts of the Lehigh Gap are effective, and the land is continuing to heal.
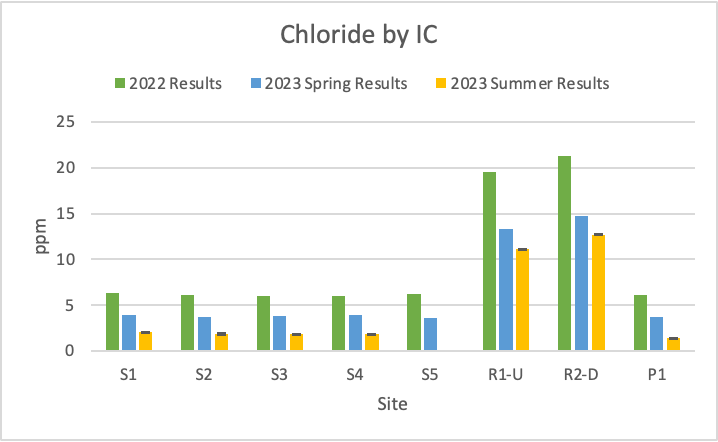
Figure 4: Bar graph depicting chloride concentration at different sites from the Lehigh Gap Nature Center from Project Lab 2022, 2023, and summer 2023.
| Site | Chloride Results (ppm) |
| S1 | 2.0428 ± 0.0159 |
| S2 | 1.8387 ± 0.07276 |
| S3 | 1.8051 ± 0.0098 |
| S4 | 1.8815 ± 0.0105 |
| S5 | N/A |
| R1 | 11.1568 ± 0.0324 |
| R2 | 12.7067 ± 0.0263 |
| P1 | 1.4587 ± 0.0079 |
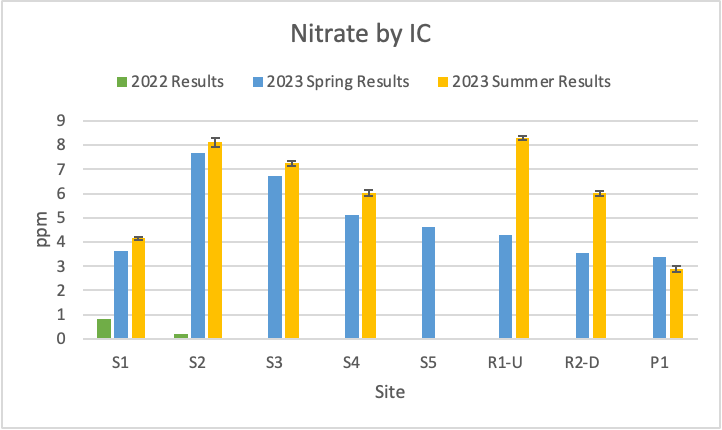
Figure 5: Bar graph depicting nitrate concentration at different sites from the Lehigh Gap Nature Center from Project Lab 2022, 2023, and summer 2023.
| Site | Nitrate Results (ppm) |
| S1 | 4.1526 ± 0.0574 |
| S2 | 8.1088 ± 0.1710 |
| S3 | 7.2576 ± 0.0998 |
| S4 | 6.0244 ± 0.1219 |
| S5 | N/A |
| R1 | 8.2976 ± 0.0826 |
| R2 | 6.0054 ± 0.0956 |
| P1 | 2.8837 ± 0.1134 |
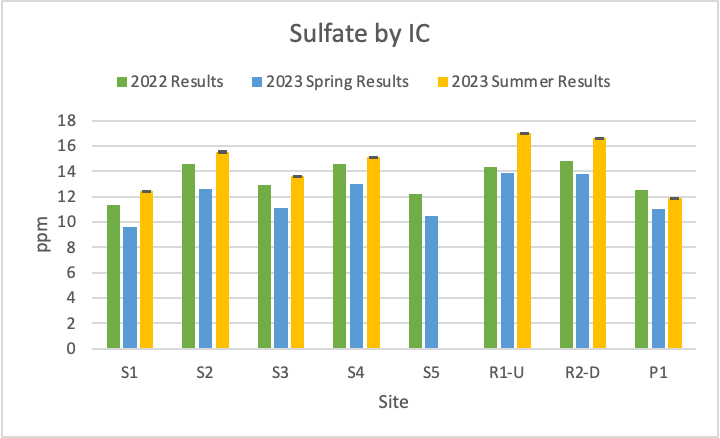
Figure 6: Bar graph depicting sulfate concentration at different sites from the Lehigh Gap Nature Center from Project Lab 2022, 2023, and summer 2023.
| Site | Sulfate Results (ppm) |
| S1 | 12.4031 ± 0.0133 |
| S2 | 15.5129 ± 0.0485 |
| S3 | 13.6359 ± 0.0181 |
| S4 | 15.0903 ± 0.0054 |
| S5 | N/A |
| R1 | 16.9861 ± 0.0152 |
| R2 | 16.5963 ± 0.0259 |
| P1 | 11.8671 ± 0.0109 |
Using ion chromatography, chloride, nitrate, and sulfate concentrations from water samples collected from the Lehigh Gap Nature Center were analyzed and found to be within healthy ranges.
