By: Cayla Zenie
Background
The Lehigh Gap Nature Center is founded on the grounds of the New Jersey Zinc Company which was established in Palmerton in 1898. The company heavily polluted the water and environment with zinc and other toxic metals. In an effort to avoid approaching a toxic level of heavy metal concentrations, it is important to monitor the amounts of metals existing in the Lehigh Gap Nature Center Water. Certain metals such as Zinc, Calcium, and Magnesium can have cascading effects on the environment when found either in very low or very high concentrations.
Calcium:
Water with low levels of calcium is typically oligotrophic, meaning there is a deficiency in plant nutrients. While water with high levels of calcium is usually eutrophic, meaning it causes an accumulation of nutrients. The normal range of calcium concentration in freshwater is between 4-100 ppm (parts per million).
Magnesium:
Magnesium has very similar effects to calcium, however, at high levels, it can interfere with plant uptake of other nutrients such as nitrogen, phosphorus, and potassium. Magnesium’s normal range in freshwater is between 5-50 ppm.
Zinc:
Zinc can sink into groundwater, and at very high concentrations, it can harm aquatic habitats. The normal range of zinc in freshwater is between 5-10 ppb (0.005-0.010 ppm).
Methods
Atomic Absorption Spectroscopy
In order to test for the concentrations of these metals, an analytical technique called Atomic Absorption Spectroscopy (AAS) was used. The atomic absorption spectrometer uses the principle that atoms absorb radiation at a specific wavelength corresponding to the energy of an electron transitioning to a higher energy atomic orbital. When this specific wavelength of light is provided, it is absorbed by the atom. The absorbance value increases linearly with concentration, which allows us to plot a calibration curve (absorbance as a function of concentration).
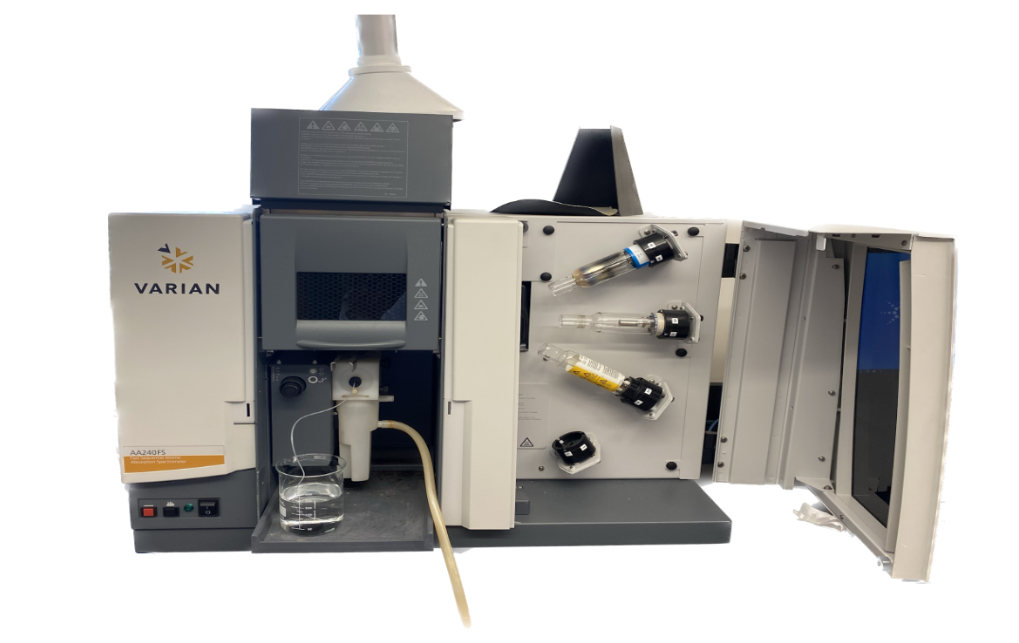
Figure 1: A picture of the Varian 240FS (Fast Sequential) Atomic Absorption Spectrometer (AAS).
| Calcium | Magnesium | Zinc | |
| Lamp Position | 2 | 3 | 4 |
| Lamp Current | 5.000 mA | 5.000 mA | 8.000mA |
| Wavelength | 285.2 nm | 285.2 nm | 217.0nm |
| Slit Width | 0.5 nm | 0.5 nm | 1.00 nm |
Procedure
To generate calibration curves, multiple standards of magnesium, calcium and zinc were made using different known concentrations. Before the standards were prepared, an acid washing technique was used to clean the glassware of any debris that might be present. The procedure called for 1 M hydrochloric acid rinse followed by deionized water rinse, 1 M nitric acid rinse followed by another deionized water rinse and one final Millipore water rinse16.
The tables below list the standard concentrations that were used:
| Calcium | Magnesium | |
| Standard 0 | 0.00 ppm | 0.00 ppm |
| Standard 1 | 0.250 ppm | 0.0500 ppm |
| Standard 2 | 0.500 ppm | 0.100 ppm |
| Standard 3 | 1.00 ppm | 0.200 ppm |
| Standard 4 | 2.00 ppm | 0.400 ppm |
| Standard 5 | 3.00 ppm | 0.600 ppm |
| Standard 6 | 5.00 ppm | 1.00 ppm |
The calcium and magnesium standards were created together using 1000 ppm calcium stock solution that was diluted to 100 ppm with Millipore water, and 1000 ppm magnesium stock solution that was diluted down to 25 ppm also using Millipore water. 2.5 mL of lanthanum solution was also added. Millipore water was then used to fill the standards up to the 25 mL line on each flask.
| Zinc Concentrations | |
| Standard 0 | 0.000 ppm |
| Standard 1 | 0.0025 ppm |
| Standard 2 | 0.005 ppm |
| Standard 3 | 0.025 ppm |
| Standard 4 | 0.100 ppm |
| Standard 5 | 0.250 ppm |
| Standard 6 | 0.500 ppm |
| Standard 7 | 0.800 ppm |
The Zinc standards were created using the following dilution method: Standards 4-7 were prepared in 100 mL flasks using 100 ppm of zinc stock solution and diluted to the fill line with Millipore water. Standards 1-3 were prepared in 50 mL flasks using 0.500 ppm of the zinc stock solution which was made by diluting the 100 ppm with Millipore water.
Calibration
After preparing the standards, they were analyzed by AAS, along with the water samples from each site. The absorbance measured for the standards were used to plot the following calibration curves:
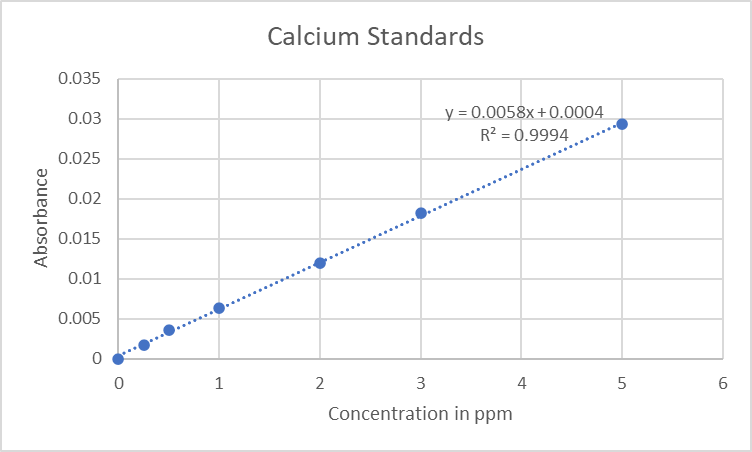
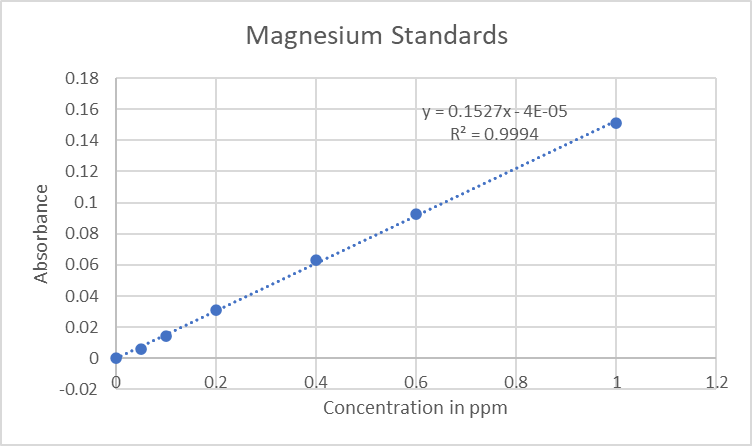
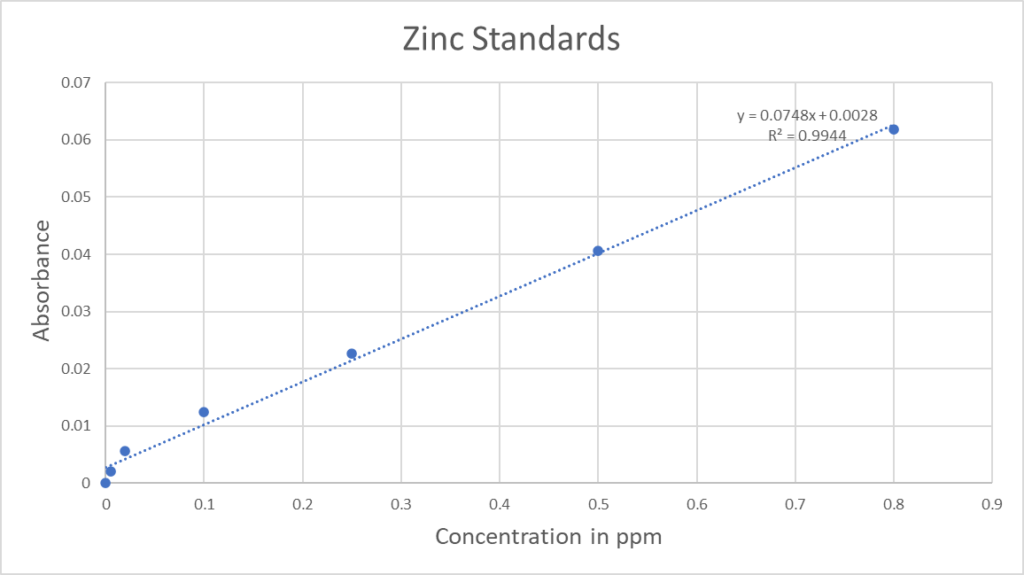
Figure 2: Calibration curves for calcium, magnesium, and zinc that were used to calculate the concentrations in the water samples
The equation of each line was used to calculate the concentration (in ppm) of calcium, magnesium, and zinc found in each sample water from the different sample sites.
Results
Based on the graphs shown below there was generally an increase in calcium, magnesium, and zinc concentration across the seven different sites. Comparing the summer 2023 summer results to the spring 2022 results, a decrease in S1, S2, and S3 can be seen for calcium, while S4, R1, R2, and P1 increased. Looking at the 2023 spring results compared to the 2023 summer results for calcium there was an increase in S1, S2, S4, R1, R2, and P1, and a decrease in S4. For magnesium, the 2023 summer results showed an increase in concentration at S1, S3, S4, R1, R2, and P1 compared to 2022 results and 2023 spring results, while S2 summer 2023 results decreased compared to previous results. Zinc showed an increase in the 2023 summer results compared to previous results at S1, R1, R2, and P1.
The river sites had the highest concentrations for magnesium and calcium, while the stream sites were more concentrated for zinc. The concentrations for zinc were found to be higher than the normal range found in freshwater; however, these levels are not considered harmful or toxic to aquatic habitats. Magnesium and calcium levels were within the normal range of freshwater.
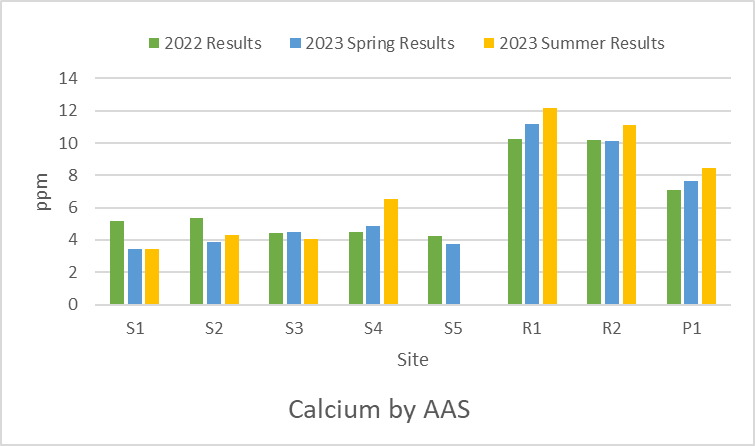
| Site | Calcium Results |
| S1 | 3.45 ppm |
| S2 | 4.31 ppm |
| S3 | 4.05 ppm |
| S4 | 6.56 ppm |
| S5 | N/A |
| R1 | 12.16 ppm |
| R2 | 11.12 ppm |
| P1 | 8.45 ppm |
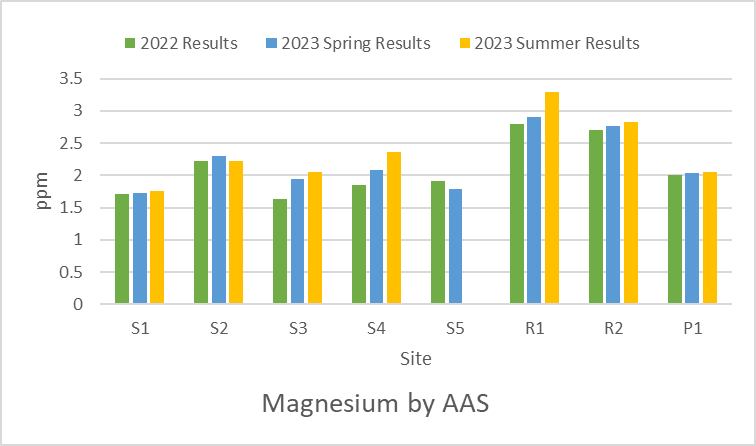
Figure 4: Bar graph depicting magnesium concentrations at the different sits from project lab 2022, 2023, and summer research 2023.
| Site | Magnesium Results |
| S1 | 1.76 ppm |
| S2 | 2.22 ppm |
| S3 | 2.06 ppm |
| S4 | 2.36 ppm |
| S5 | N/A |
| R1 | 3.29 ppm |
| R2 | 2.83 ppm |
| P1 | 2.06 ppm |
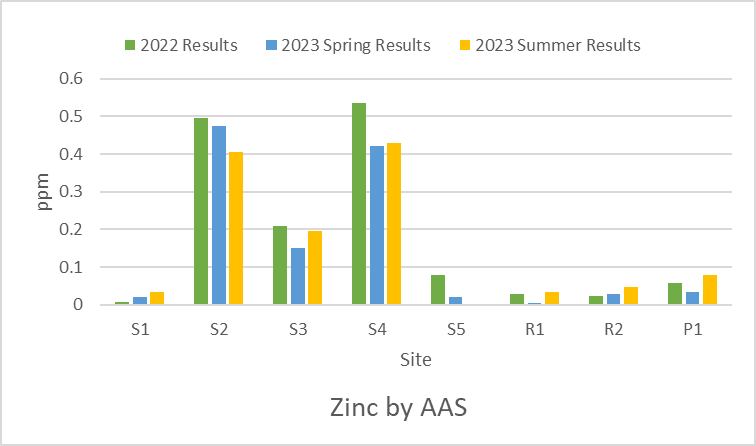
| Site | Zinc Results |
| S1 | 0.0332 ppm |
| S2 | 0.4043 ppm |
| S3 | 0.1968 ppm |
| S4 | 0.4282 ppm |
| S5 | N/A |
| R1 | 0.0332 ppm |
| R2 | 0.0479 ppm |
| P1 | 0.0798 ppm |
