By: Elizabeth Abrams
Phosphate Exigence

In efforts to restore the land, the Lehigh Gap Nature Center (LGNC) has used fertilizers which, among other nutrients, include phosphates. Phosphates are beneficial to plant growth, but they can also run off into surrounding streams and ponds and enter the groundwater. This can support unwanted growth, such as algal blooms, which can prevent fish and other plants from getting the nutrients, oxygen, and sunlight they need to survive.
Ideally, phosphate levels in freshwater should fall between 0.005 and 0.05 ppm12, which is the level that would occur naturally without outside intervention.
Figure 1: Diagram of the phosphorus cycle14
Method
In measuring phosphate, testing looks specifically for the form orthophosphate (PO43-), which is the simplest form of phosphorus found in nature. This form is taken up, used, and made by organisms. To test for orthophosphate in LGNC water and beyond, an ascorbic acid method for UV-Visible Spectroscopy is used. The method used combined reagents that, when mixed with samples and standards, bind to orthophosphate forming phosphomolybdic acid which turns a molybdenum blue with the inclusion of ascorbic acid. It is with this color that UV-Vis can be utilized.
UV-Visible Spectroscopy
UV-Visible Spectroscopy, or UV-Vis, is an instrumentation method that uses select wavelengths to measure the absorbance of samples when compared to a reference solution.

UV-Vis works by emitting visible or UV light from a light source. A monochromator is then used to select the proper wavelength for data collection. That wavelength of light then passes through both the sample solution (P) and the reference solution (P0). The radiation intensity after passing through the sample and reference are then compared to produce an absorbance value (A) output found using the equation: A = log(P0/P).
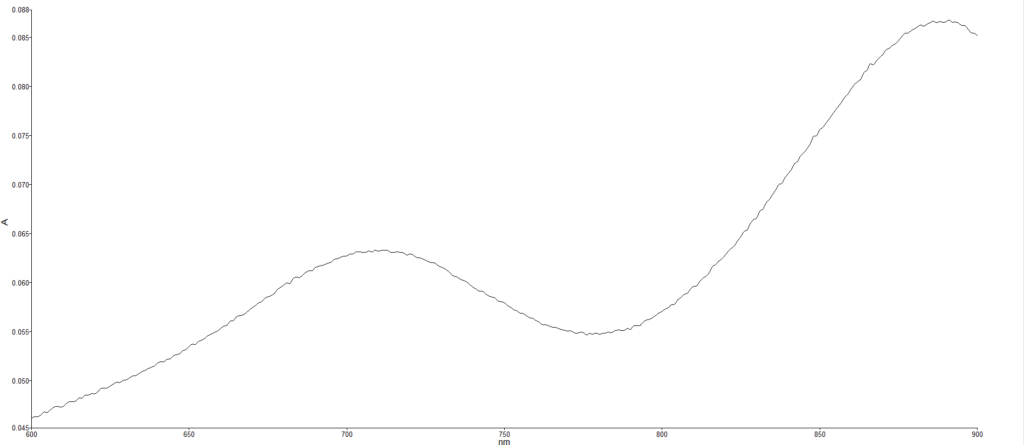
For the sake of this analysis, the proper wavelength to use needed to be found using a scan in which a sample is placed into the instrument and a range of wavelengths are passed through the sample and reference to produce absorbance values across an absorbance spectrum. The highest peak on the spectrum indicates the best wavelength to properly determine absorbance. For orthophosphate analysis on the particular PerkinElmer Lambda 35 UV-Vis spectrometer used, 889.4 nm was determined to be the best wavelength.
Figure 3: sample absorbance spectrum for molybdenum blue made with phosphomolybdic acid modified with ascorbic acid to produce a blue color. The x-axis shows wavelength in nanometers and the y-axis shows absorbance.
Reagents
In order to get absorbance readings to determine phosphate concentrations, reagents must be used to make compounds that can produce absorbance readings. Orthophosphate alone does not absorb on the UV or Visible spectra, so reagents are used to form a colored compound that can be detected. More specifically, 5N (2.5 M) sulfuric acid and ammonium molybdate interact with phosphate present to form phosphomolybdic acid which, in the presence of potassium antimonyl tartrate, turns molybdenum blue at the introduction of ascorbic acid. The absorbance, and concentration by extension, of molybdenum blue can be used to determine the concentration of phosphate.
Standards
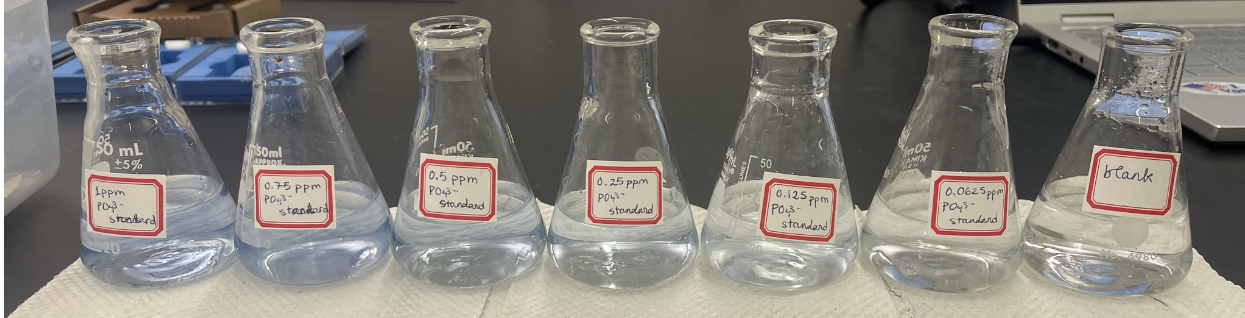
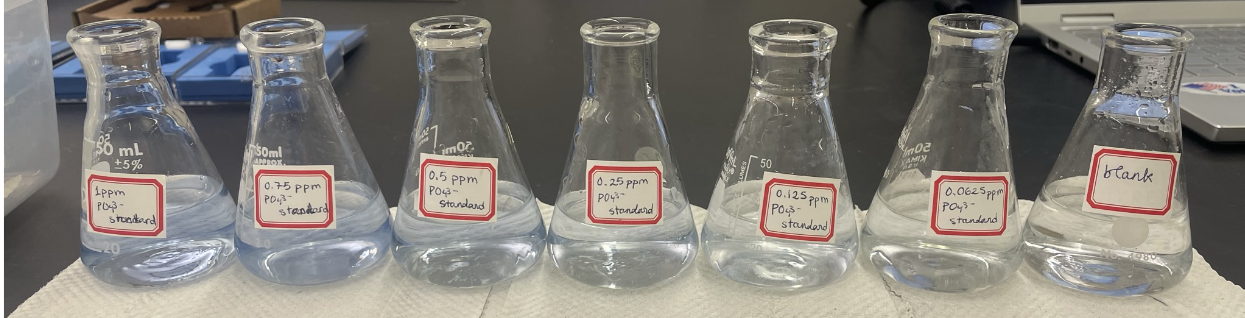
Figure 4: Erlenmeyer flasks containing reagent-treated standards at 0 ppm, 0.0625 ppm, 0.125 ppm, 0.25 ppm, 0.5 ppm, 0.75 ppm, and 1 ppm.
Standards are solutions with known amounts of analyte, phosphate in this case, at a range of concentrations that can be used to attribute instrument readout to analyte concentration. For the purpose of water analysis for LGNC, standards at 0 ppm phosphate (blank), 0.0625 ppm, 0.125 ppm, 0.25 ppm, 0.35 ppm, 0.5 ppm, and 0.75 ppm. All of the standards had reagent added to form the molybdenum blue with the blank (0 ppm) standard having only water and reagent. All absorbance values were corrected with the blank by subtracting the absorbance output from the blank to ensure the only absorbance being observed was the molybdenum blue from the phosphate.
Procedure
Glassware Preparation
Before beginning phosphate analysis, all glassware was washed with hot 6M hydrochloric acid and rinsed with Millipore water to ensure to outside contamination.
Reagents
5N Sulfuric Acid
- 208.33 mL of 6M sulfuric acid was diluted with Millipore water to make 500 mL of 5N sulfuric acid.
- The finished solution was stored in a plastic bottle and kept with other acids.
Potassium Antimonyl Tartrate Solution (C8H4K2O12Sb2 · 3H2O)
- 0.0549 g of potassium antimonyl tartrate trihydrate was dissolved in Millipore water and diluted to 100 mL.
- The finished solution was stored in a volumetric flask.
Ammonium Molybdate Solution ((NH4)2MoO4)
- 4 g of ammonium molybdate was dissolved in Millipore water and diluted to 100 mL.
- This solution took a long time to dissolve, so additional solution was made on to 500 mL scale to prepare for continued phosphate analysis.
- The finished solution(s) were stored in (a) volumetric flask(s).
Ascorbic Acid Solution
- 1.76 g of L-ascorbic acid was dissolved in Millipore water and diluted to 100 mL.
- This solution was stored and kept refrigerated in a volumetric flask and was remade fresh weekly.
Combined Reagent
The combined reagent was made by combining all of the above reagents in a specific order in specific amounts:
- 25 mL 5N sulfuric acid
- 2.5 mL potassium antimonyl tartrate solution
- 7.5 mL ammonium molybdate solution
- 10 mL ascorbic acid solution
The solution was swirled at the addition of each reagent. Once complete, the combined reagent was usable for up to 4 hours.
Standards
In order to make standards, stock solutions of 100 ppm and 10 ppm PO43- concentration had to first be made. The 100 ppm solution was made using monobasic potassium phosphate (KH2PO4).
| Dilution | Amount of Solute | Final Volume |
|---|---|---|
| 100 ppm PO43- stock | 0.0143 g of KH2PO4 | 100 mL |
| 10 ppm PO43- stock | 2500 µL from 100 ppm stock | 25 mL |
| 0.75 ppm standard | 1875 µL from 10 ppm stock | 25 mL |
| 0.5 ppm standard | 1250 µL from 10 ppm stock | 25 mL |
| 0.35 ppm standard | 875 µL from 10 ppm stock | 25 mL |
| 0.25 ppm standard | 625 µL from 10 ppm stock | 25 mL |
| 0.125 ppm standard | 313 µL from 10 ppm stock | 25 mL |
| 0.0625 ppm standard | 156 µL from 10 ppm stock | 25 mL |
Instrument Preparation
Before using the UV-Vis, an approximately 5 ppm methylene blue solution was used to collect an absorbance spectrum. Because there is a lot of literature that shows a consistent methylene blue absorbance spectrum, scanning the methylene blue sample proved to be a reliable way to check that the UV-Vis was calibrated and working as expected.
Calibration
To make the calibration curve, 10 mL of each standard was placed into separate 50 mL Erlenmeyer flasks, with an additional flask holding 10 mL of Millipore water to be used as the reagent blank. 1.6 mL of combined reagent was then added to each flask before all standards were left to sit for 10 minutes. Once the reagent had been added, the solutions were usable for testing for a total of 30 minutes.
Each sample, including the reagent blank, were then placed in the instrument to measure absorbance at 889.4 nm. These values were then used to produce a table and a calibration curve.
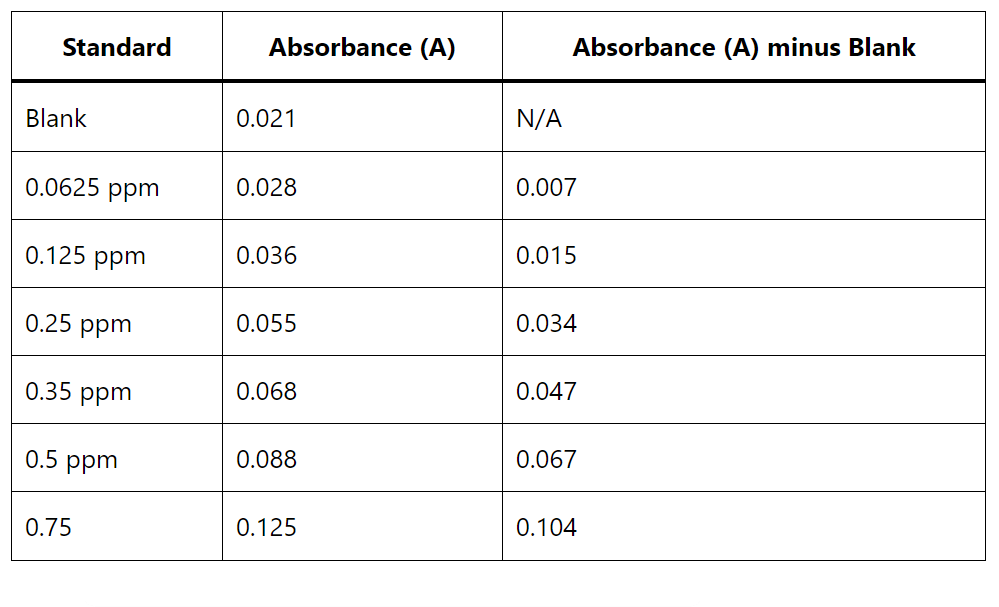

Table 2: Measured and adjusted absorbance levels for calibration
Figure 5: Graph depicting phosphate absorbance across standards at concentrations 0.0625 ppm, 0.125 ppm, 0.25 ppm, 0.35 ppm, 0.5 ppm, and 0.75 ppm.
Sample Preparation and Measurement
Each sample was filtered and separated into three flasks, each containing 10 mL of each sample to allow for testing in triplicate. An additional reagent blank was also made. Each sample was then treated with one drop of phenolphthalein indicator to ensure the samples were not too basic. While these samples did not change color, 5N sulfuric acid would have been added dropwise to dispel any color if the samples had not remained colorless. Each sample was then treated with 1.6 mL of combined reagent and allowed to sit for 10 minutes. Once the reagent had been added, the samples were usable for testing for a total of 30 minutes. Samples were transferred to quartz cuvettes.
Absorbance values of all samples were measured using a Perkin Elmer Lambda 35 UV-Vis Spectrometer at 889.4 nm, and corrected using the reagent blank.
Results

After measuring all samples in triplicate, the calibration curve was used to determine phosphate concentration and the values for each site were averaged.
Based on the results, it appears that the phosphate levels across all of the sites are within normal levels, between 0.005 and 0.05 ppm12.
It does appear, however, that S1 and S2, a pipe and seep, have low levels. The pond location also has a similarly low phosphate level.
S3 and S4, both falls, had relatively high levels when compared to the rest of the results, which could be due to the plant life that the water passes through.
Finally, R1-U and R2-D, the upstream and downstream river sites, had relatively high levels and had similar levels to one another, indicating no significant upstream versus downstream change.
Table 3: Phosphate concentration results across all 7 sampling sites.
